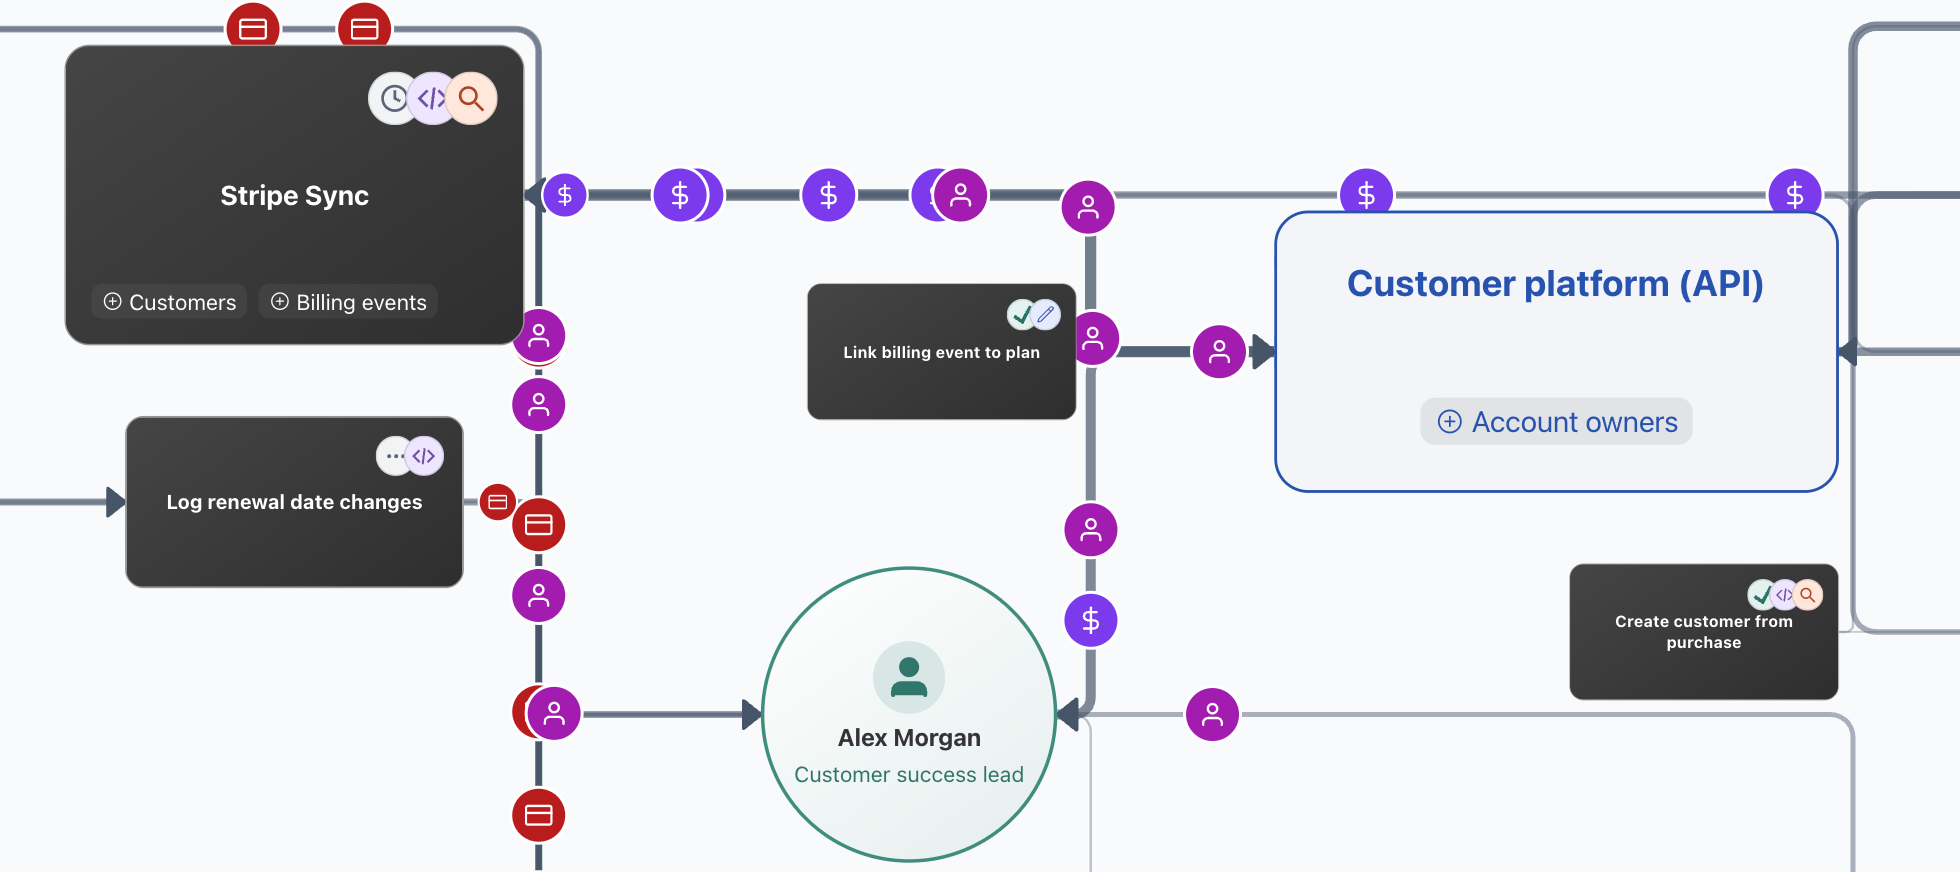
Orloi can now visualise months of Airtable activity on one page: the operational map.
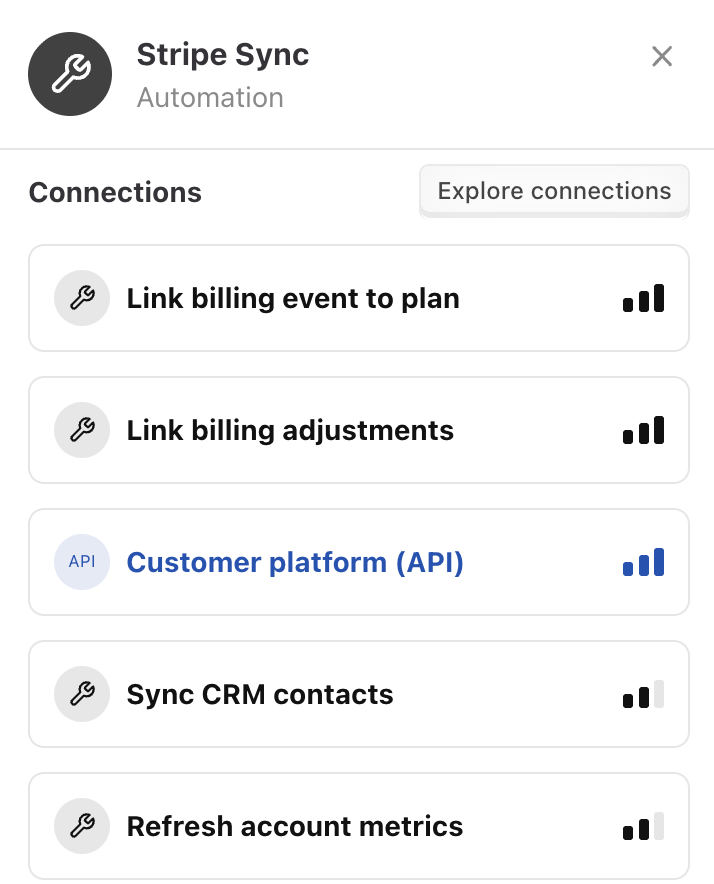
Each node on the diagram represents a "source": someone or something that can create, update or delete a particular Airtable record.
The result? One map showing the "business" of the Airtable base. A map that shows how records get created, where they usually get updated afterwards. Productive sources are bigger with a lot of records flowing to and back from them, quiet barely active sources are small, with thin connections.
For an admin of a particular Airtable base, the map visualises something that they may already carry in their head. The admin has set up the automations, they maintain them and fix them when something goes wrong.
Still, the map can function as a useful refresher and something to check, when thinking about architecture and operations. It becomes visually clear which automations are doing most of the work and which team members do fundamental work when maintaining data.
Instead of scrolling through pages of feeds and breadcrumbs the data comes alive.
How did Orloi get there?
The primary data foundation of Orloi is record and schema events. Airtable records being created, updated, deleted.
Orloi creates a read-only connection via an Airtable webhook and captures changes in real time. Airtable also provides a dedicated Audit API, but it's limited to enterprise plans, the webhooks API works on all plans and the real-time aspect is useful.
The main challenge of this data capture is that these webhook events can be very numerous. An Airtable base can emit a lot of changes, especially if there's a lot of system activity such as syncs and computation. If a formula contains NOW() and the value is frequently changing, it can mean tens of thousands of events per minute or more.
Some system activity can be carefully filtered out. But even automation and manual activity can still produce a flood of events.
Airtable allows you to change data in bulk. You don't necessarily need a script to change a lot of data at once. If you select a field in a table, copy and then paste into different column, that's potentially tens of thousands of changes.
Even typing into a field can lead to multiple events being emitted. Because Airtable records change in real time as you're typing.
If the operational map just looked at raw record changes, one person who happened to move some data from one field to another, would suddenly look like the most important data editor and would visually overshadow those who make smaller changes but more frequently, several times per day.
That's why the raw event changes get passed into a so-called "compaction layer".
Turning events into actions
Orloi receives events from Airtable in real time. But besides persisting these events into the connected Postgres database, it schedules a compaction. It runs several minutes after and it reviews these new changes and looks for patterns.
There is no AI in this step, only plain deterministic data analysis.
The code looks for patterns:
- Same field, or same set of fields, being changed by same actor in many records
- Many records created with same data by same actor
- Many records deleted by same actor
- … and so on
Then separate action events are being created. Suddenly 100 events can be represented by just one item, which we may understand as action. This collection of actions then much more naturally represents "activity" in the base. Many actions mean something has been repeatedly active, not just that it happened to change a lot of data at once. It creates a more readable feed but it's also a much better source for further data analysis for other features, such as the operational map.
Finding connections
While having the separate source of action events helps, there's more to be done to gather a proper data substrate for the operational map.
For each action event, we know what's been changed, by whom and when. This then allows to programmatically measure:
- Which actors edit the same records?
- Which actors edit the same fields on the same records?
- What is the median time in between these actions? Is there a consistency?
From these clues, such as the number of related record changes, Orloi computes a connection score.
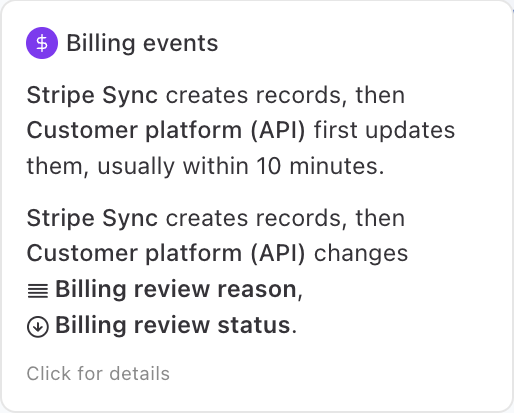
If an automation creates a record and another automation consistently updates it right after, the connection score here would be naturally high. The other automation always updates the record and it does it consistently quickly after.
But similar connections may be detected between manual changes and API changes as well. It's clear which sales managers often update the same customer records or support tickets.
Delivery and display
Detecting these connections may require querying a larger amount of data. Doing this analysis at the last moment when the map is opened would not work. The data structure has to be prepared ahead of time.
So just like Orloi turns the raw record changes into separate action events, it then also creates a separate data source for the operational map, ahead of time. Orloi queries events page by page, does statistical analysis and persists the computed results back into the connected database.
Based on this data, the map can finally be displayed. The frontend uses a library called ELK.js to visually distribute the nodes on the 2-dimensional surface. Strong arrows are used for the strong connections, actors with a lot of activity are bigger, actors that tend to create or edit records early tend to be on the left, actors that edit them later are further right.
What's next?
This entire operational map does not need an AI (LLM). The compaction of raw events into action events is done via straightforward analysis. The later connection aggregation is also plain data analysis. Even the visualisation is done purely algorithmically by a few pre-defined constraints.
But an LLM could help in the process. The map could be enriched with extra tags, certain connections could be highlighted where an LLM would infer extra meaning. An operational bottleneck and other items could show up on such map, once agents are reviewing the data further.
The philosophy of Orloi is to do as much as possible without AI, to lower cost, reduce hallucinations and create more consistent results. But LLMs can definitely provide extra value.
Therefore, AI-enhanced operational map is on the roadmap.
And the map itself can be studied and compared over time - with or without AI. How do the connections change? If one automation consistently followed another and then this connection disappeared, that's something to check. If an API node used to be the most active and suddenly now is lagging behind others, it may signal an operational problem. These are the future insights Orloi will focus on, to keep Airtable bases and operations built on top of them running smoothly.